When New York’s Climate Leadership and Community Protection Act was signed in 2019, word was that the new mandates would reduce electricity costs for the average person.
“Benefits of New York State’s Climate Leadership: Affordable Energy | Reducing energy consumption and utility bills by increasing access to ever-improving clean, efficient, and reliable energy solutions.”
– CLCPA Fact Sheet
“Energy affordability is a big issue for all New Yorkers. Nobody wants to spend more of their hard-earned money on energy… relying on fossil fuels to power our homes, businesses and transportation needs exposes New Yorkers to continued volatility and price increases.”
– Addressing Energy Affordability Concerns
One of the more sober evaluations of the CLCPA in 2019 was written by the the nonpartisan Citizens Budget Commission:
“As additional renewable resources come online, costs can be expected to increase, at least in the short term, and variability among regions may also increase.”
Which prediction was more correct? In our comprehensive analysis of the last seven years of electricity prices, we have found found that costs have skyrocketed statewide alongside the adoption of renewable energy and electric vehicles.
1. Average electricity costs went up anywhere from 29 to 74%
Based on monthly “day-ahead” averages compared from 2017-2020 to 2021-2024, every region saw significant increases in costs The average region’s costs went up by 51% (not weighted for population).
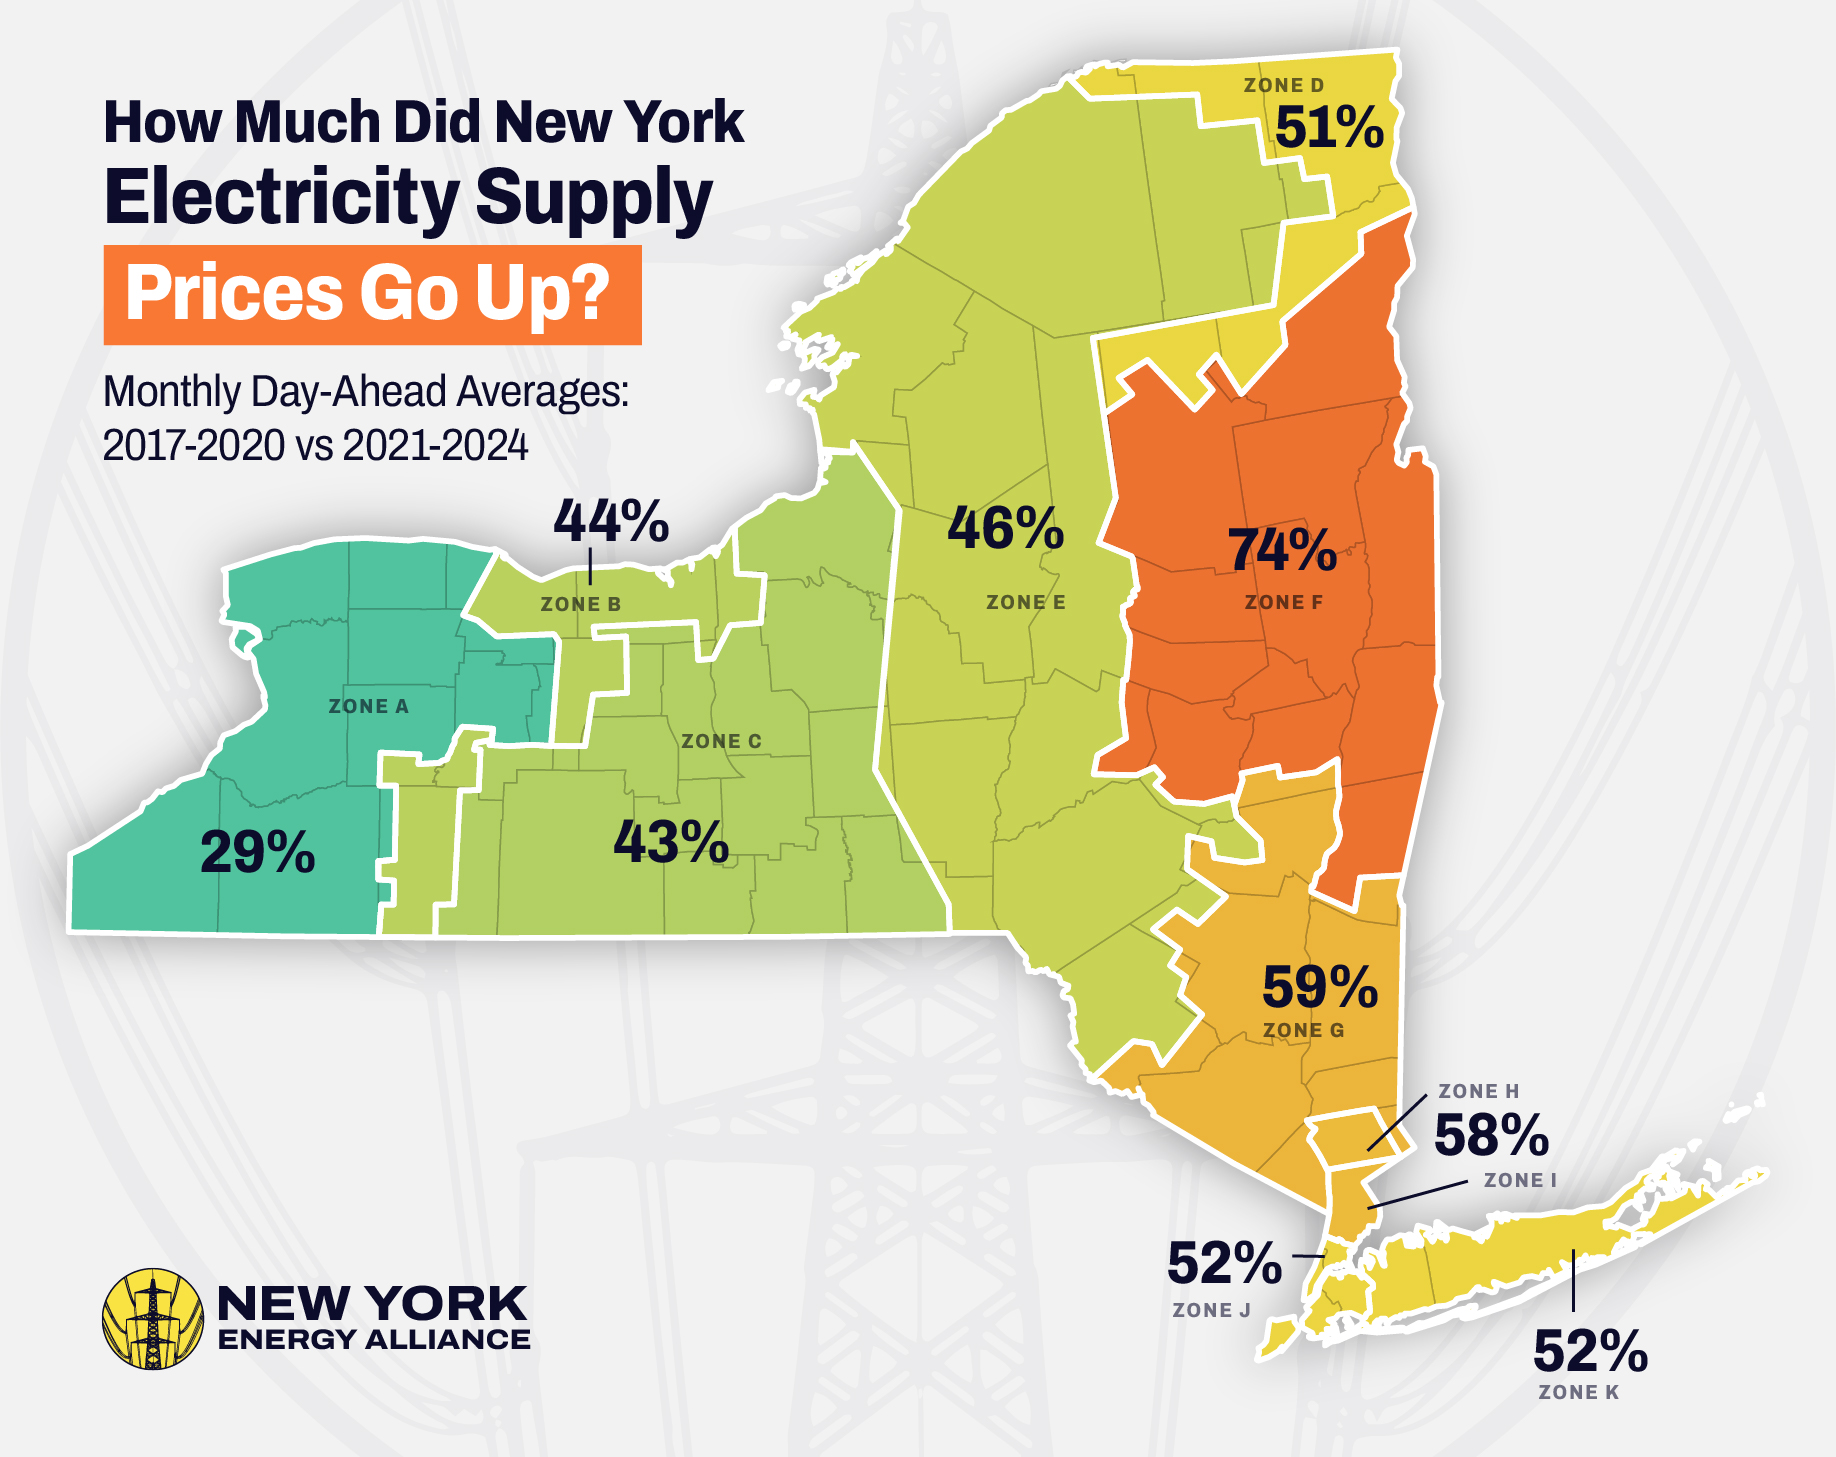


Zone A (West): 29%
Zone B (Genesee): 44%
Zone C (Central): 43%
Zone D (North): 51%
Zone E (Mohawk Valley): 46%
Zone F (Capital Region): 74%
Zone G (Hudson Valley): 59%
Zone H (Millwood): 58%
Zone I (Dunwoodie): 58%
Zone J (NYC): 52%
Zone K (Long Island): 52%
2. The Capital Region and Hudson Valley Increased the Most
The Capital Region is where the climate laws like the CLCPA were passed, and the Hudson Valley, the birthplace of the environmental movement, is where the laws were largely drafted and lobbied for. Tragically, ratepayers in their NYISO regions were hit hardest by the changes in New York’s electricity markets.
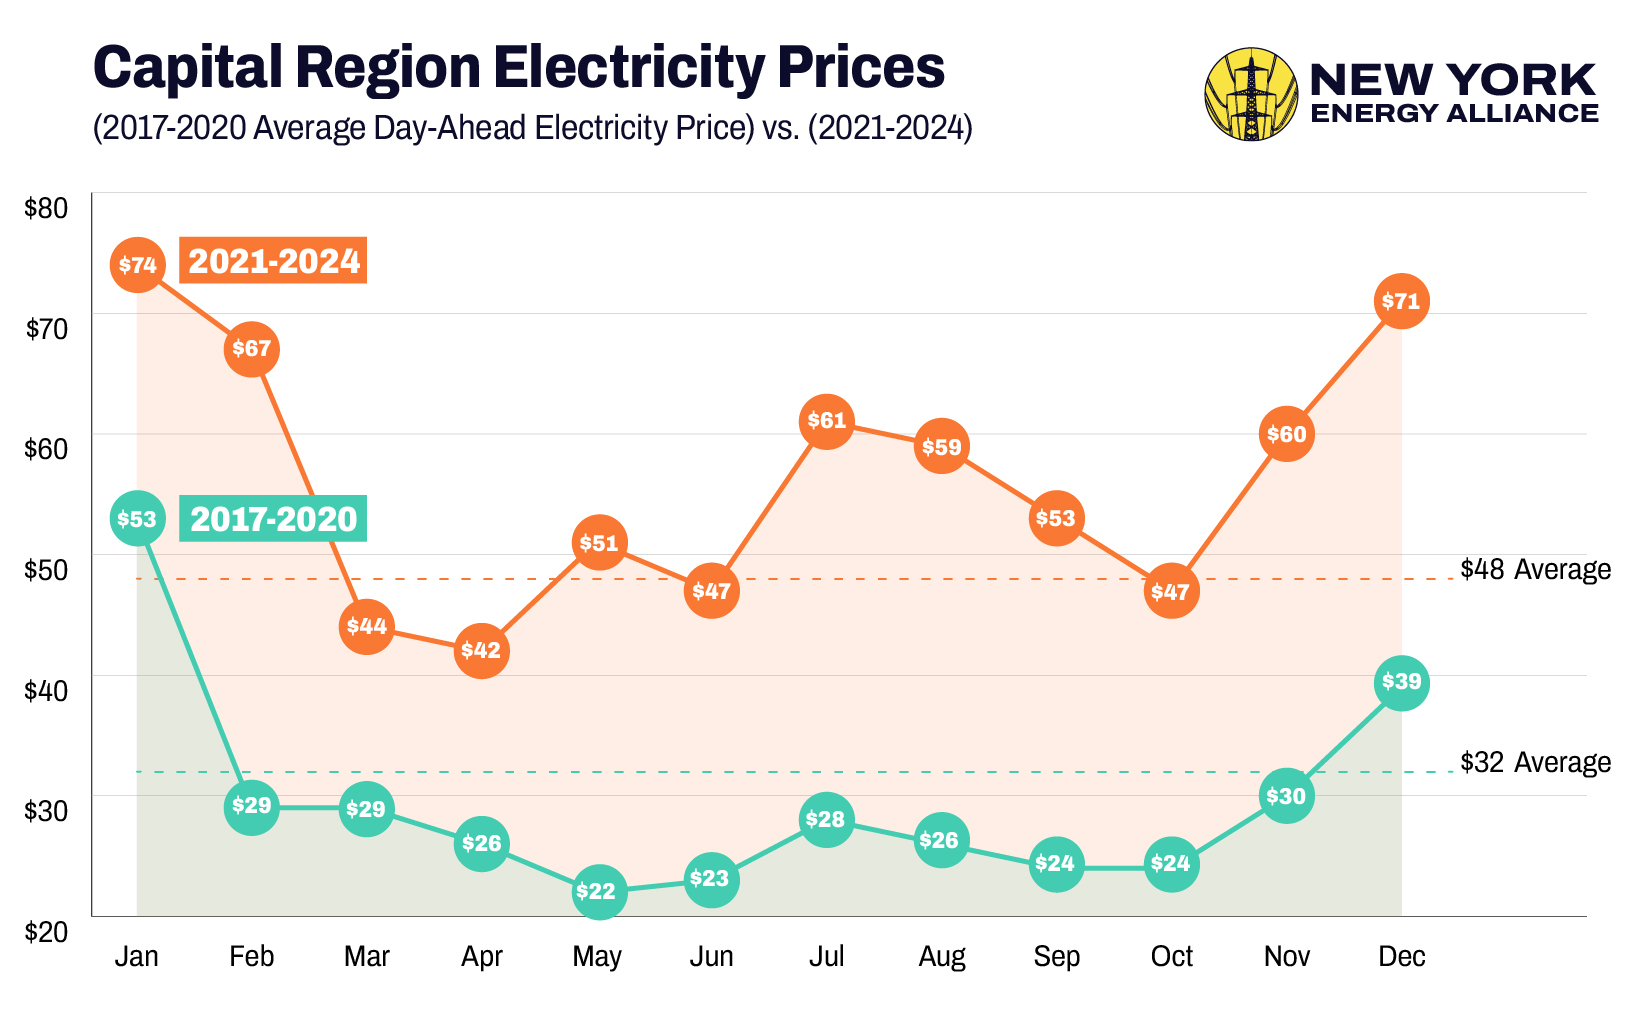
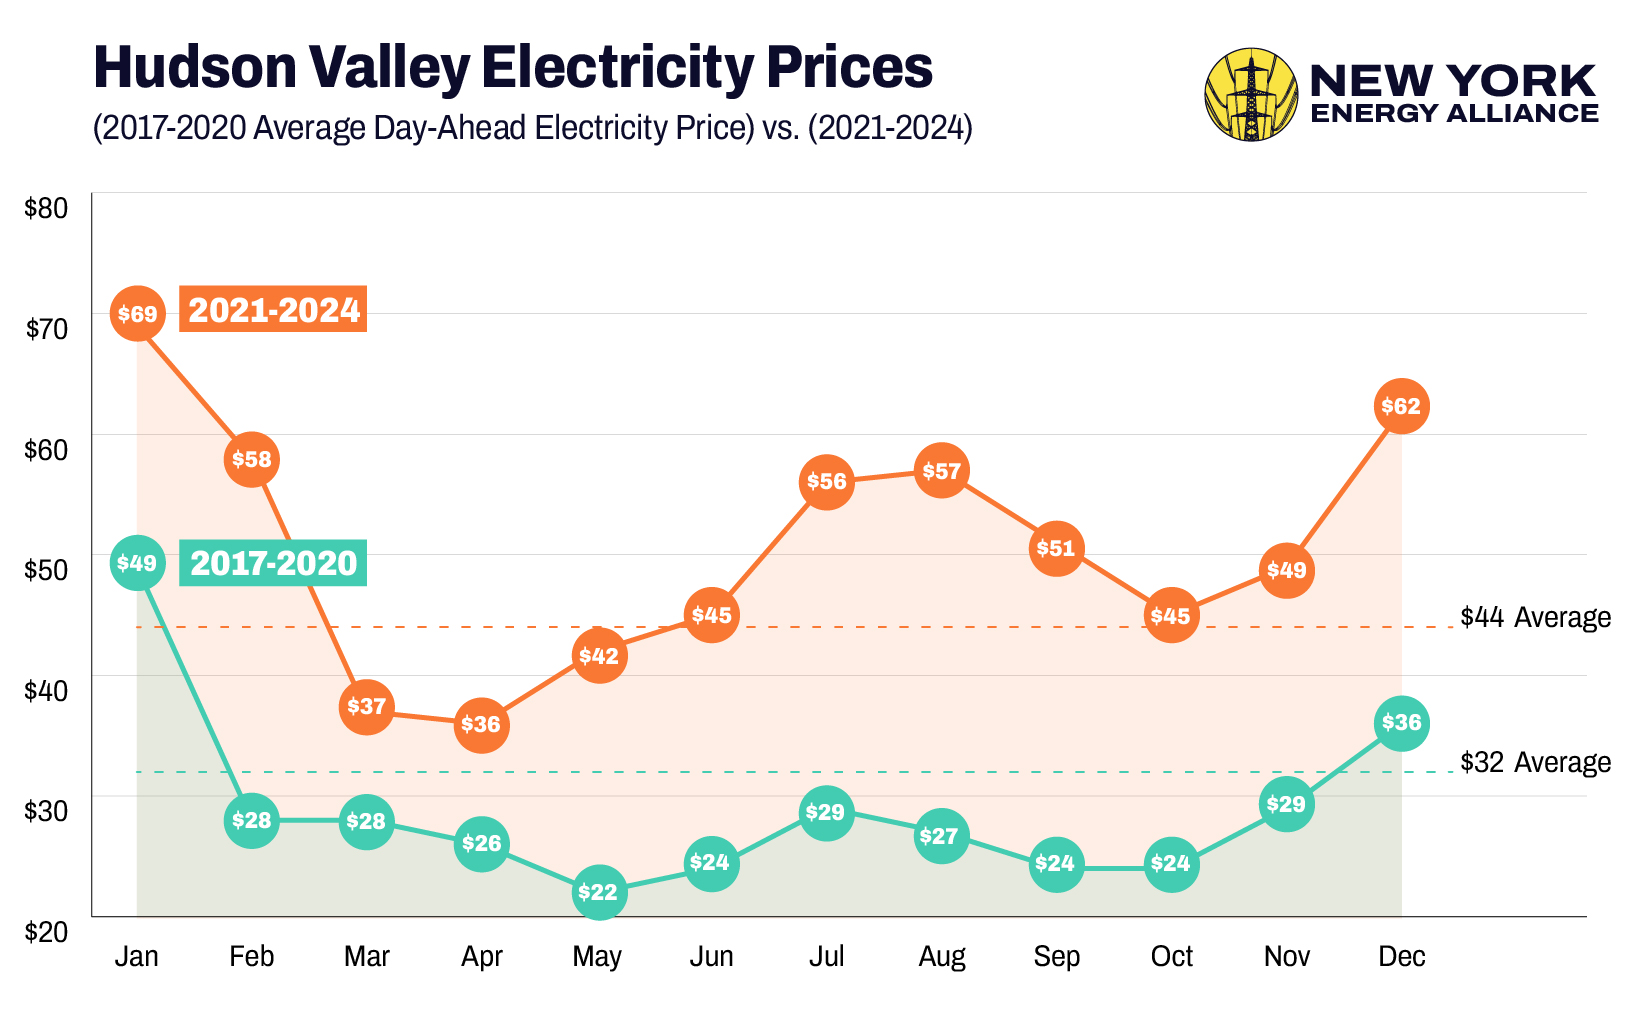
| Capital Region (2017-2020 Average Day-Ahead Electricity Price) vs. (2021-2024) | Hudson Valley (2017-2020 Average Day-Ahead Electricity Price) vs. (2021-2024) | |
|---|---|---|
| January | $53 —> $74 | $49—> $69 |
| February | $29 —> $67 | $28 —> $58 |
| March | $29 —> $44 | $28 —> $37 |
| April | $26 —> $42 | $26 —> $36 |
| May | $22 —> $51 | $22 —> $42 |
| June | $23 —> $47 | $24 —> $45 |
| July | $28 —> $61 | $29 —> $56 |
| August | $26 —> $59 | $27 —> $57 |
| September | $24 —> $53 | $24 —> $51 |
| October | $24 —> $47 | $24 —> $45 |
| November | $30 —> $60 | $29 —> $49 |
| December | $39 —> $71 | $36 —> $62 |
| Average | $32 —> $48 | $32 —> $44 |
While the entire state was subject to market and geopolitical forces beyond its control, certain attributes of each region’s power grid either inoculated it or made price shocks more extreme. For the Capital Region and Hudson Valley, it was the rapid adoption of rooftop “behind the meter” solar, combined with total reliance on natural gas without hydroelectric production or nuclear power that did them in.
Capital Region Power Production Profile:
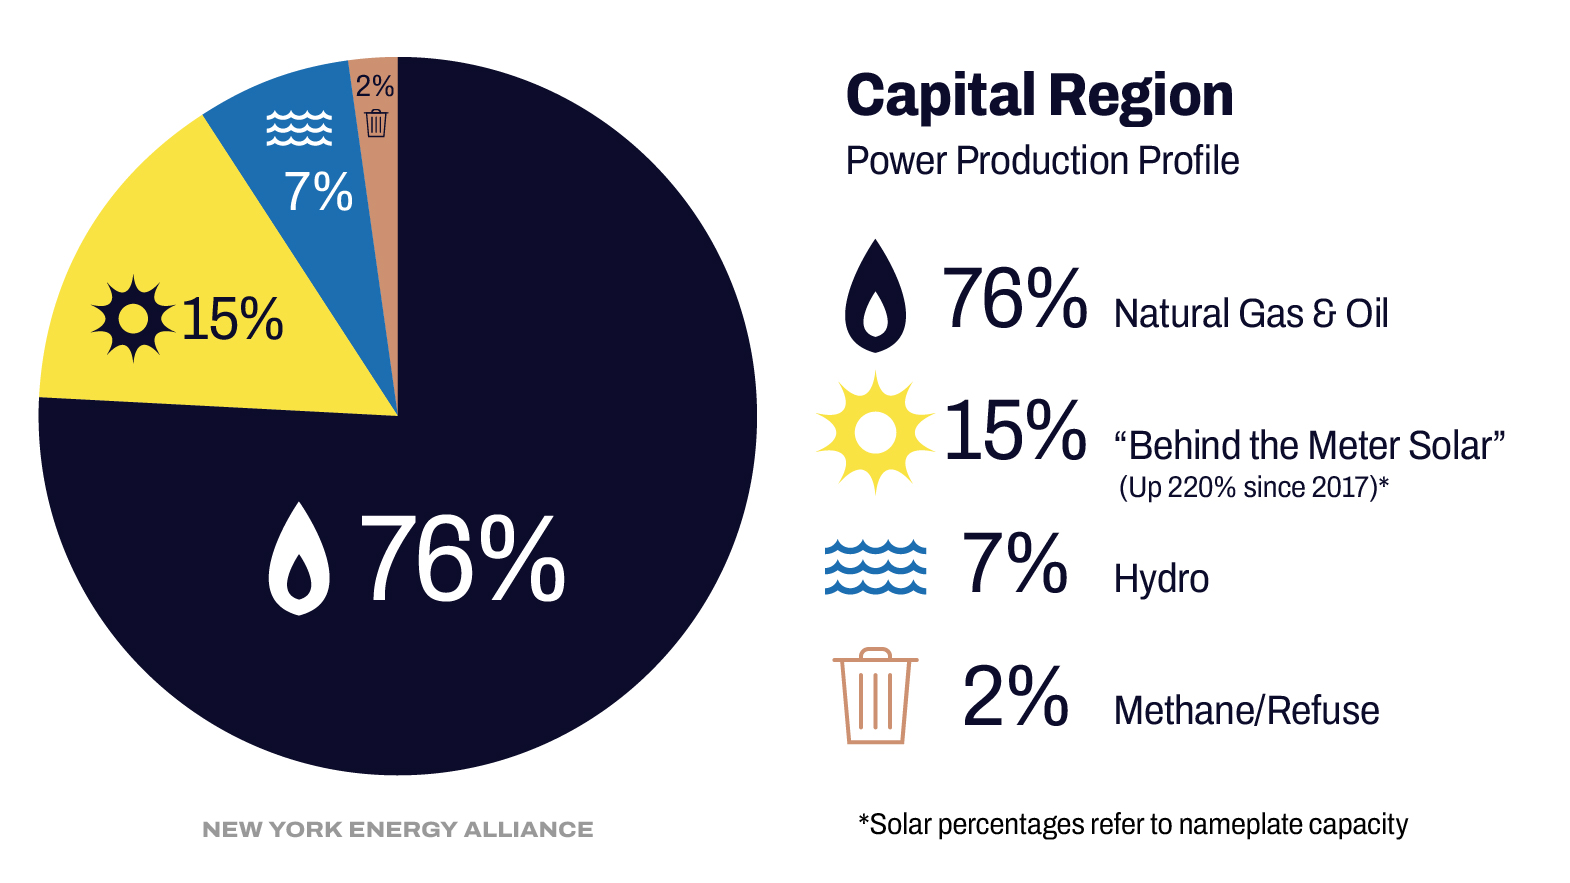
76% Natural Gas & Oil
15% “Behind the Meter Solar” (Up 220% since 2017)*
7% Hydro
2% Methane/Refuse
Hudson Valley Region Power Production Profile:

87% Natural Gas & Oil
12% “Behind the Meter Solar” (Up 341% since 2017)*
1% Hydro
* Solar percentages refer to nameplate capacity
3. Western and Central NY’s Nuclear & Hydro Outperformed Upstate’s Gas & Solar
While the Hudson Valley and Albany’s green activists got the headlines and protest footage in the name of building solar panels and shutting down nuclear plants like Indian Point, it was the humble people of Western NY that got to enjoy cheaper power that also happens to be carbonless.
The Moses Niagara hydro plant, as well as three nuclear plants near Oswego and Rochester carried the load to help Zone A (29% increase) and Zone B (44% increase) and Zone C (43% increase) have significantly lower increases than the Capital Region (74% increase) and the Hudson Valley (58% increase). As you can see, Zones A, B and C also were able to affordably accommodate rapid buildouts in intermittent renewables thanks to the baseload provided by hydro and nuclear.
Western Region Power Production Profile:
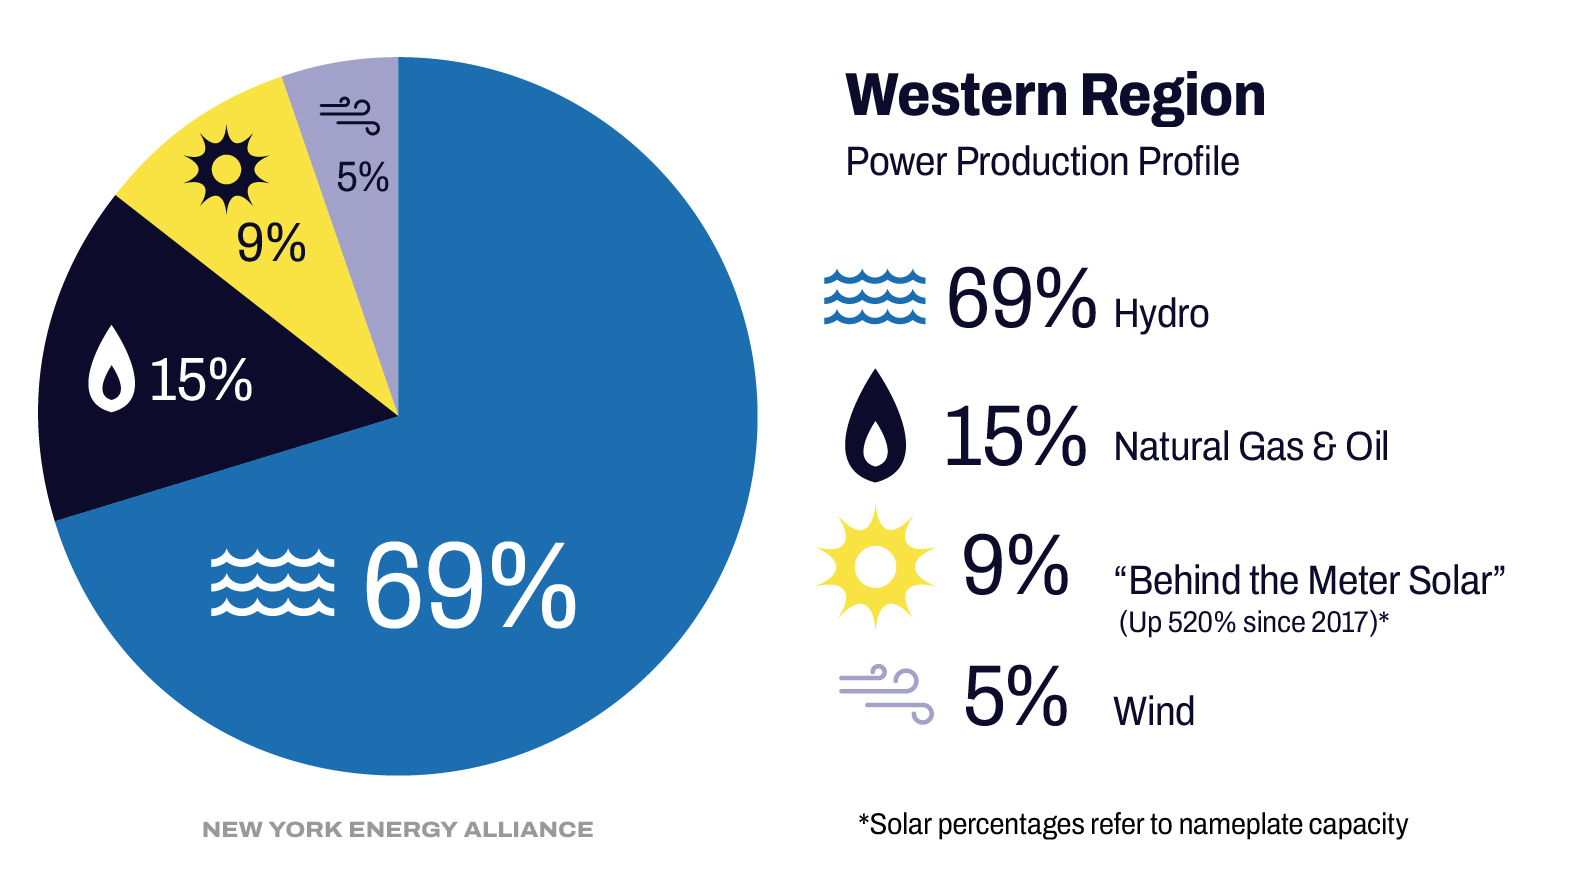
69% Hydro
15% Gas & Oil
9% “Behind the Meter Solar” (Up 520% since 2017)*
5% Wind
Genesee Region Power Production Profile:
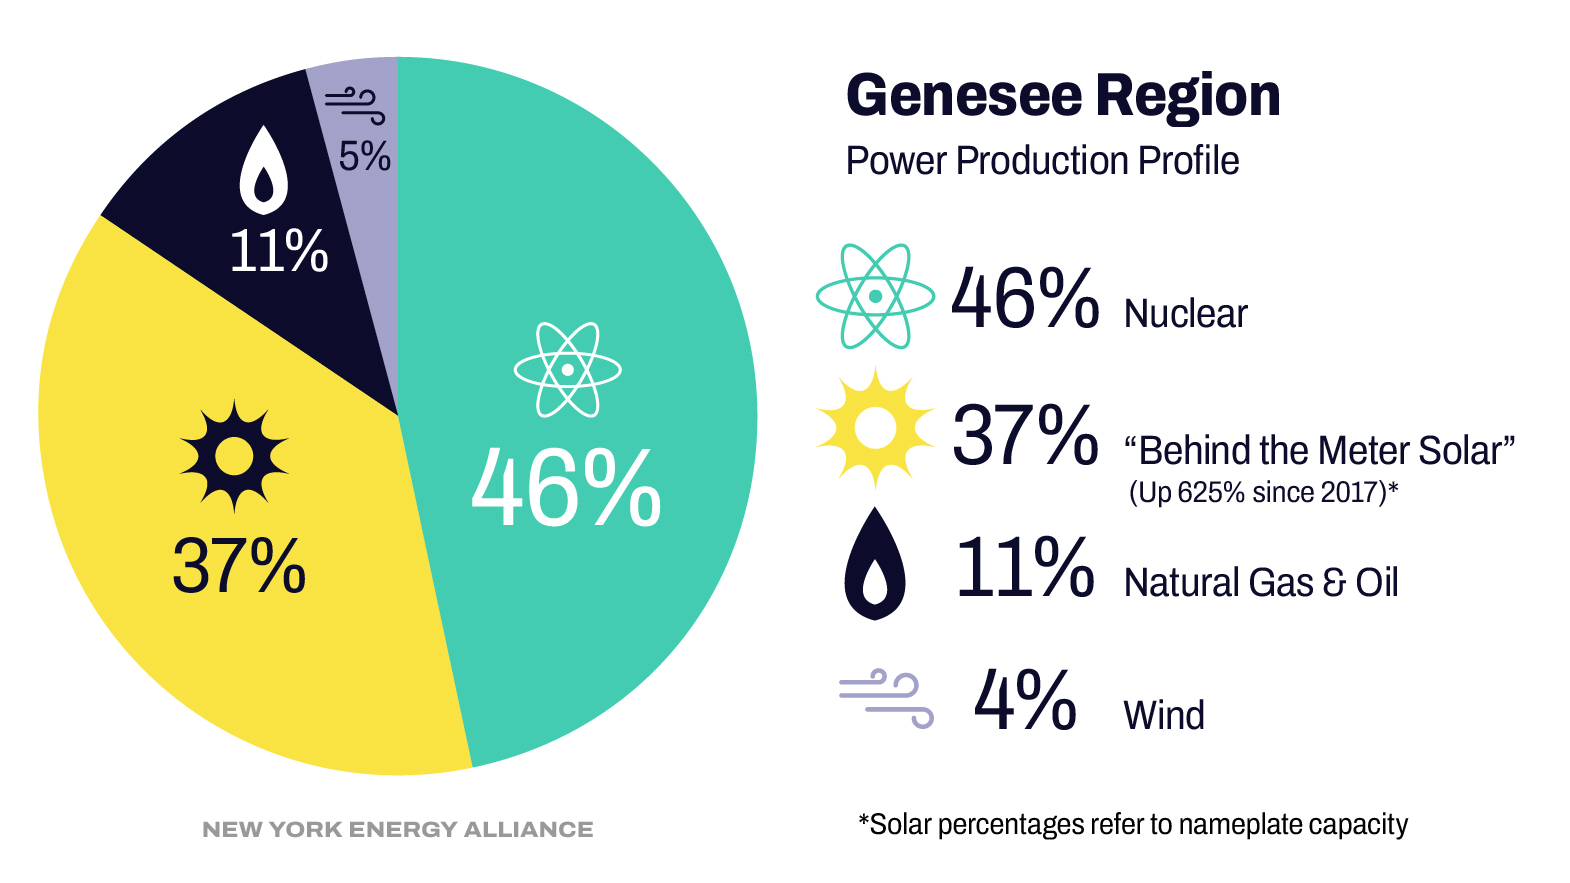
46% Nuclear
37% Solar (Up 652% since 2017)*
11% Gas & Oil
4% Wind
Central Region Power Production Profile:
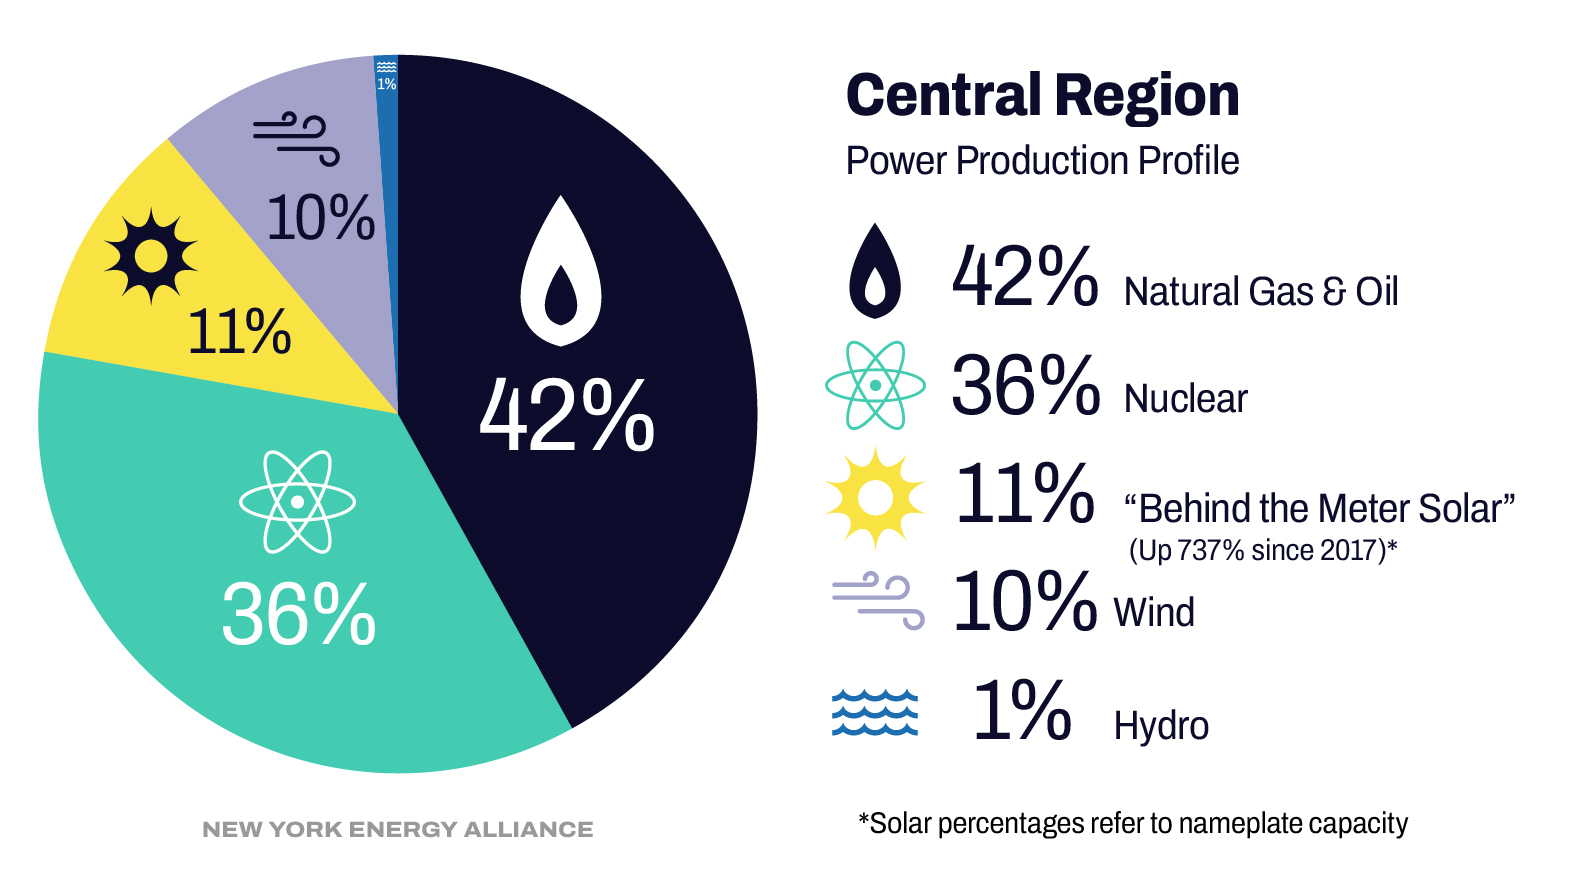
42% Oil & Gas
36% Nuclear
11% Solar* (Up 737% since 2017)*
10% Wind
1% Hydro
* Solar percentages refer to nameplate capacity
4. Costs Increased Most in the Winter and Summer
When comparing the 2017-2020 period to the 2021-2024 period, the only brief respite in brutal price increases is in March and April, where unusually mild winters have helped ease the burden on New York electricity consumers.
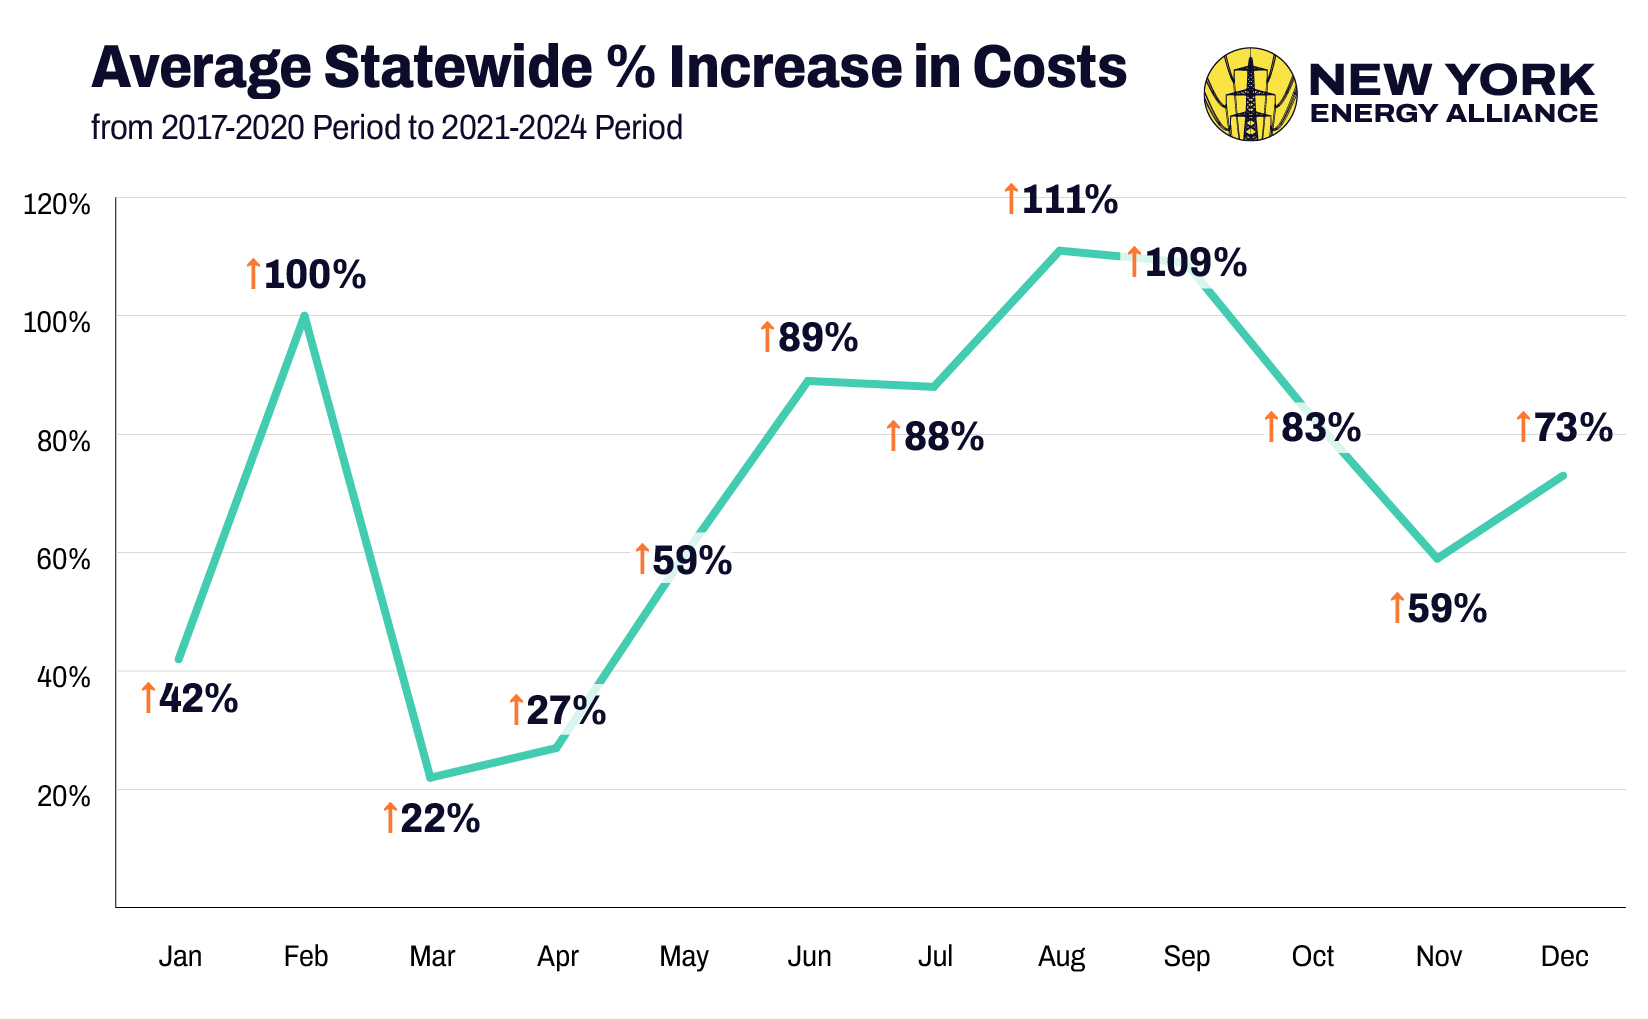
| Month | Average Statewide % Increase in Costs from 2017-2020 Period to 2021-2024 Period |
|---|---|
| January | 42% |
| February | 100% |
| March | 22% |
| April | 27% |
| May | 59% |
| June | 89% |
| July | 88% |
| August | 111% |
| September | 109% |
| October | 83% |
| November | 59% |
| December | 73% |
Conclusion
The trends in this article are set to continue for the foreseeable future. The roster of upcoming additions to New York’s energy grid are fully saturated with intermittent renewable energy that increases the day-to-day variability of the grid and electricity prices:
Environmentalists and solar energy lobbyists of Albany remain convinced that New York just needs to ignore the massive increases in consumer prices and keep overbuilding solar and wind.
But it’s time for Albany to admit that it has a problem. Only a rational energy policy that considers consumer costs, reliability, land use AND emission reductions in a holistic manner will help New York thrive again.